Main Areas
| Area | Purpose |
|---|---|
| Dashboard | Executive and operational overview of assets, scans, severities, high-risk findings, and recent activity. |
| Assets | Root domains, URLs, IP addresses, CIDR ranges, discovered subdomains, exposed services, TLS, WAF/CDN, and technology fingerprints. |
| Scans | Scan queue, scan history, source tracking, progress, discovered services, and result summary. |
| Findings | Vulnerability triage, evidence review, risk score, status workflow, ownership, and remediation guidance. |
| Reports | CSV, JSON, and PDF exports for remediation, integration, audit, and management sharing. |
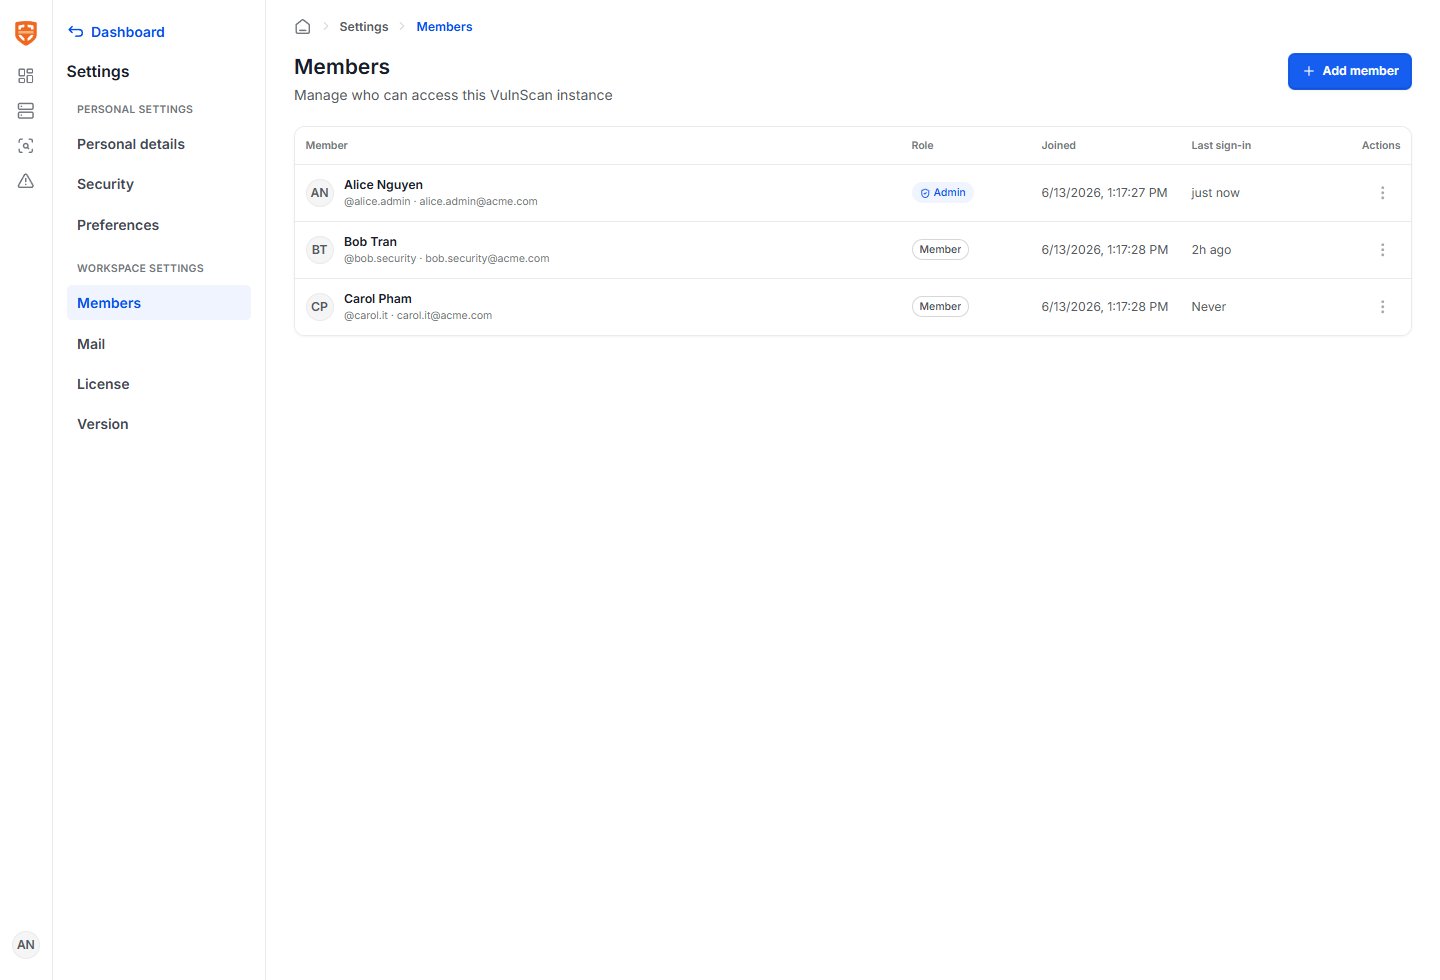
| Workspace settings | Members, mail provider, license detail, workspace-level configuration, and operational settings. |
| User menu | Personal profile, display name, language, password, and logout. |
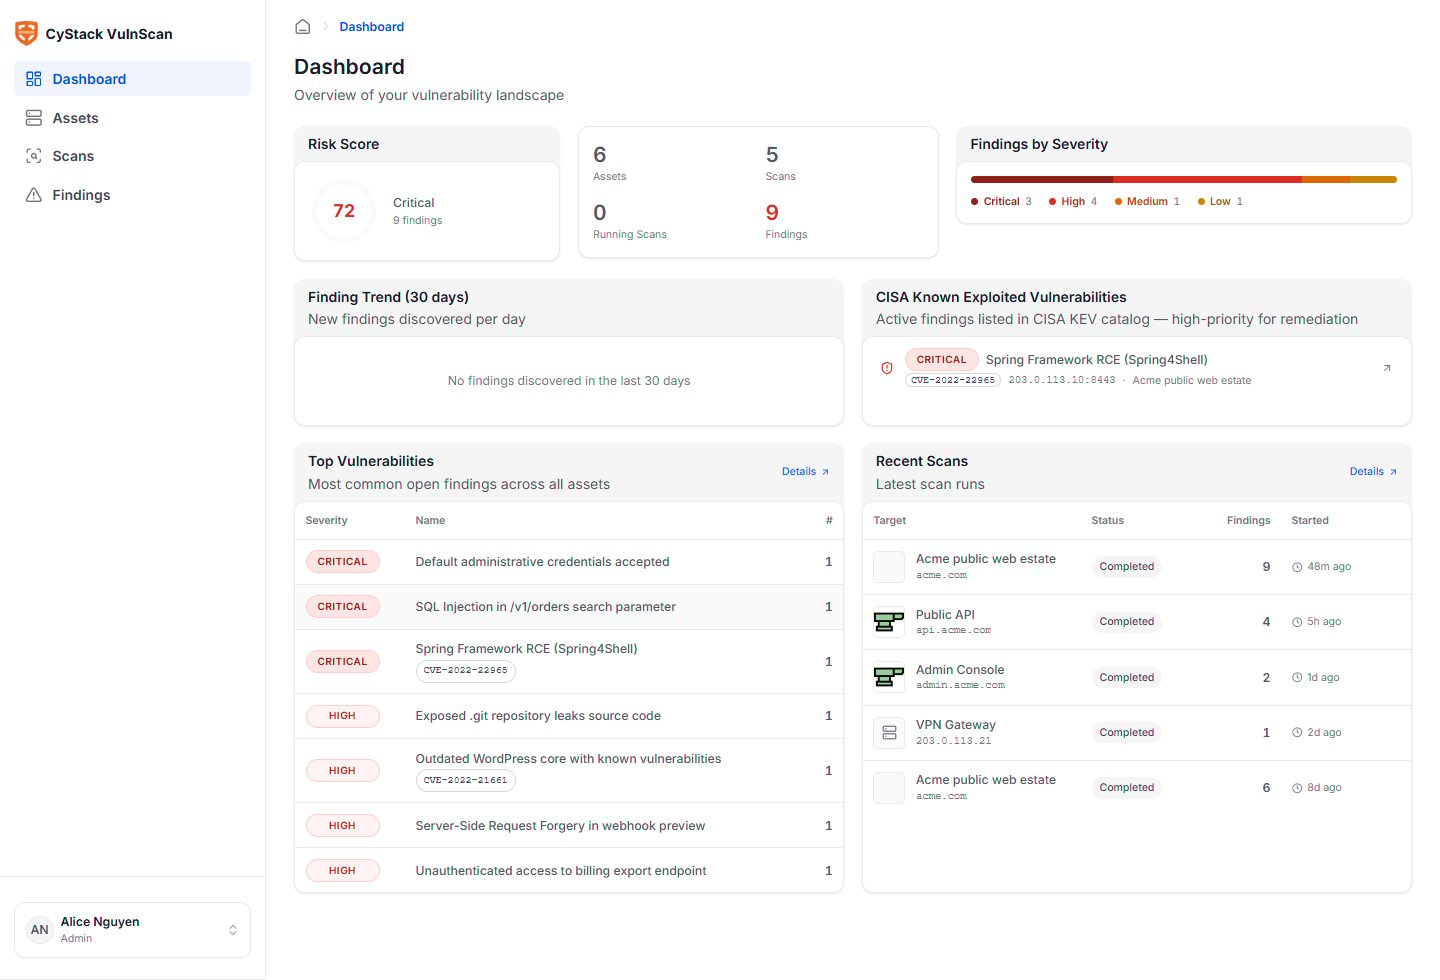
Dashboard
Use the dashboard to understand current exposure before drilling into technical detail:- Total assets under management.
- Number of scans and scan health.
- Critical, High, Medium, Low, and Informational findings.
- Recently completed scans.
- High-priority issues requiring remediation.
- Trend and distribution indicators where enough scan history exists.
User Menu
The user menu is intentionally separated from workspace administration. It contains settings that affect only the signed-in user:- Personal details and display name.
- Password change.
- Interface language.
- Logout.
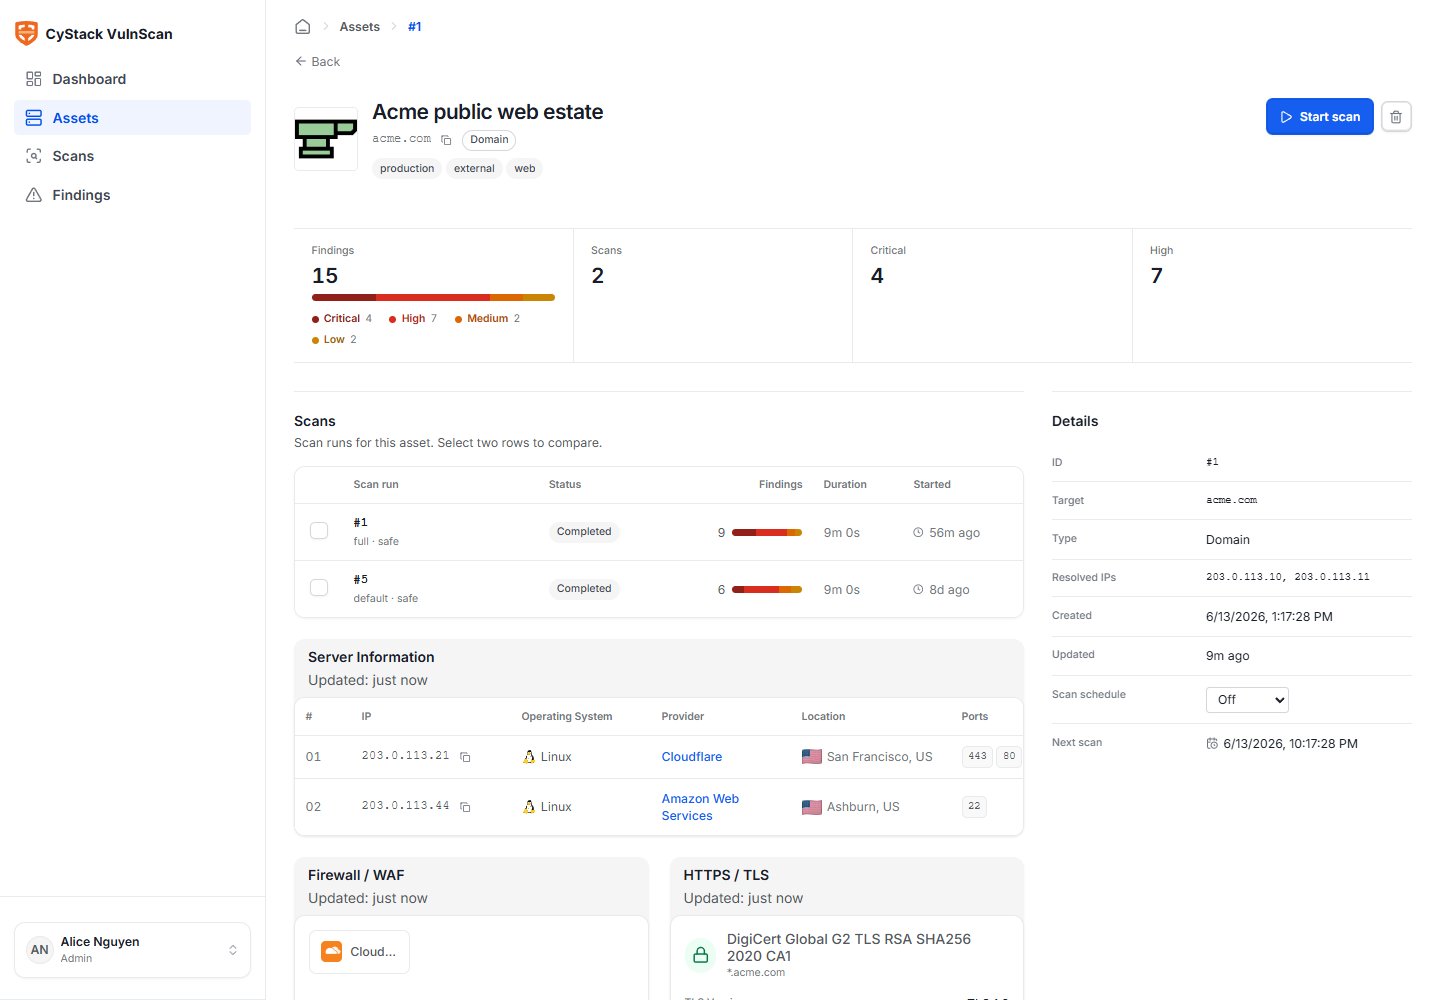
Asset Workflow
The asset workflow starts with a licensed target and ends with normalized scan scope.- Open Assets.
- Add a root domain, URL, IP, or CIDR range.
- Review discovery signals on the asset detail page.
- Confirm subdomains, services, TLS, WAF/CDN, and technology fingerprints.
- Start a scan only after the asset context looks correct.
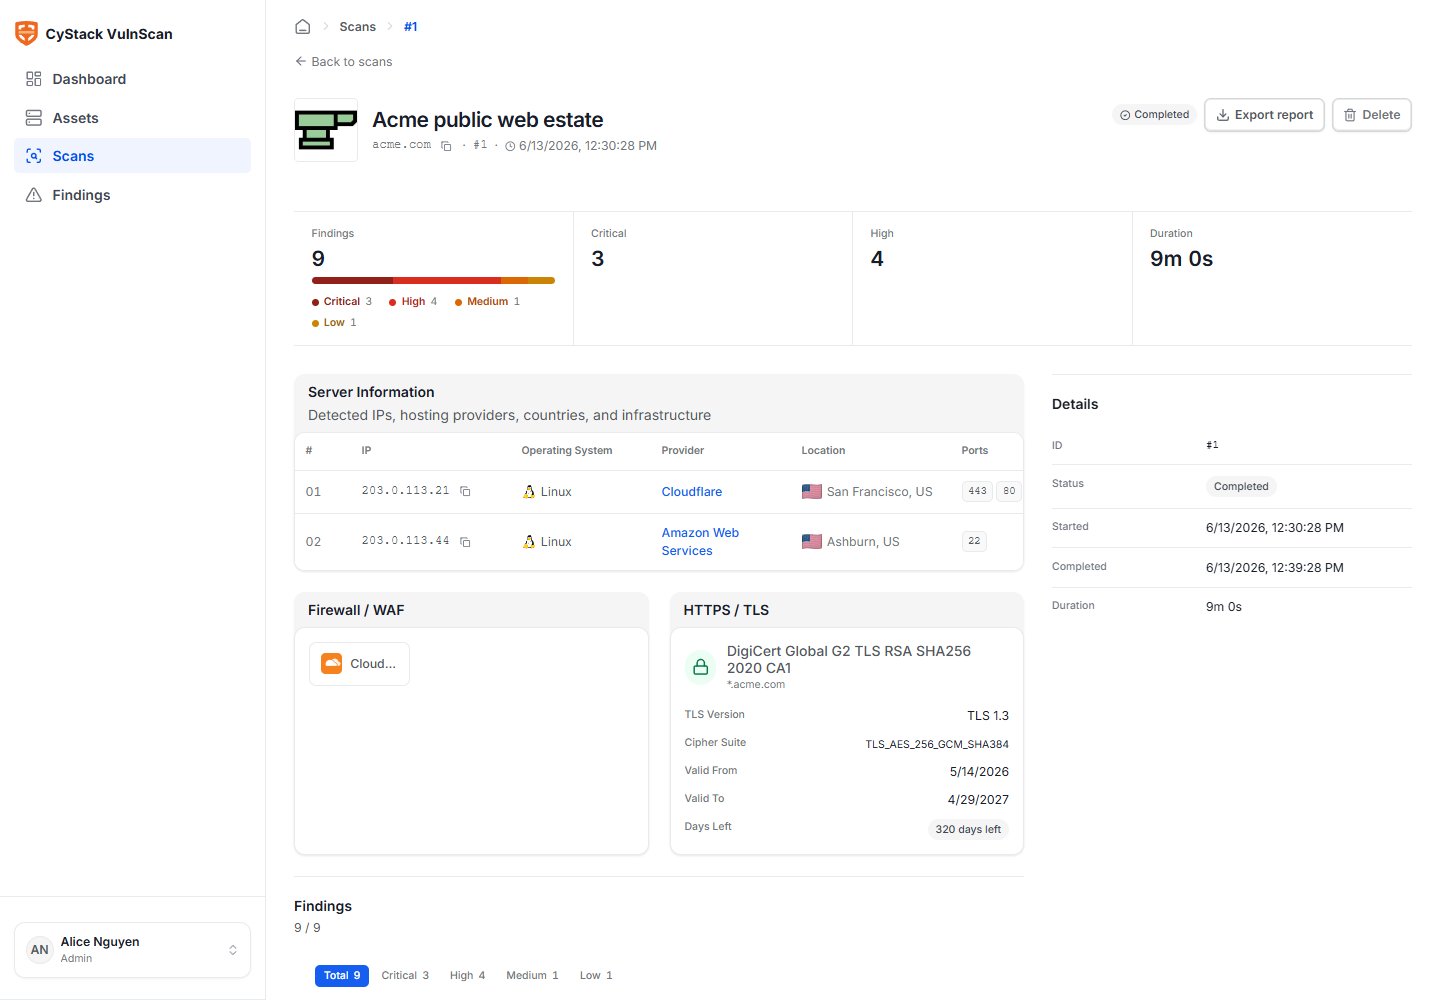
Scan Workflow
The scan workflow is designed to make scope and source visible:- Start a scan from the asset detail page or scan list.
- Add authentication context if the application requires it.
- Monitor status in the scan detail page.
- Review discovered services and vulnerability counts.
- Triage findings from Critical to Low.
- Export CSV/JSON for technical workflows or PDF for management distribution.
Finding Workflow
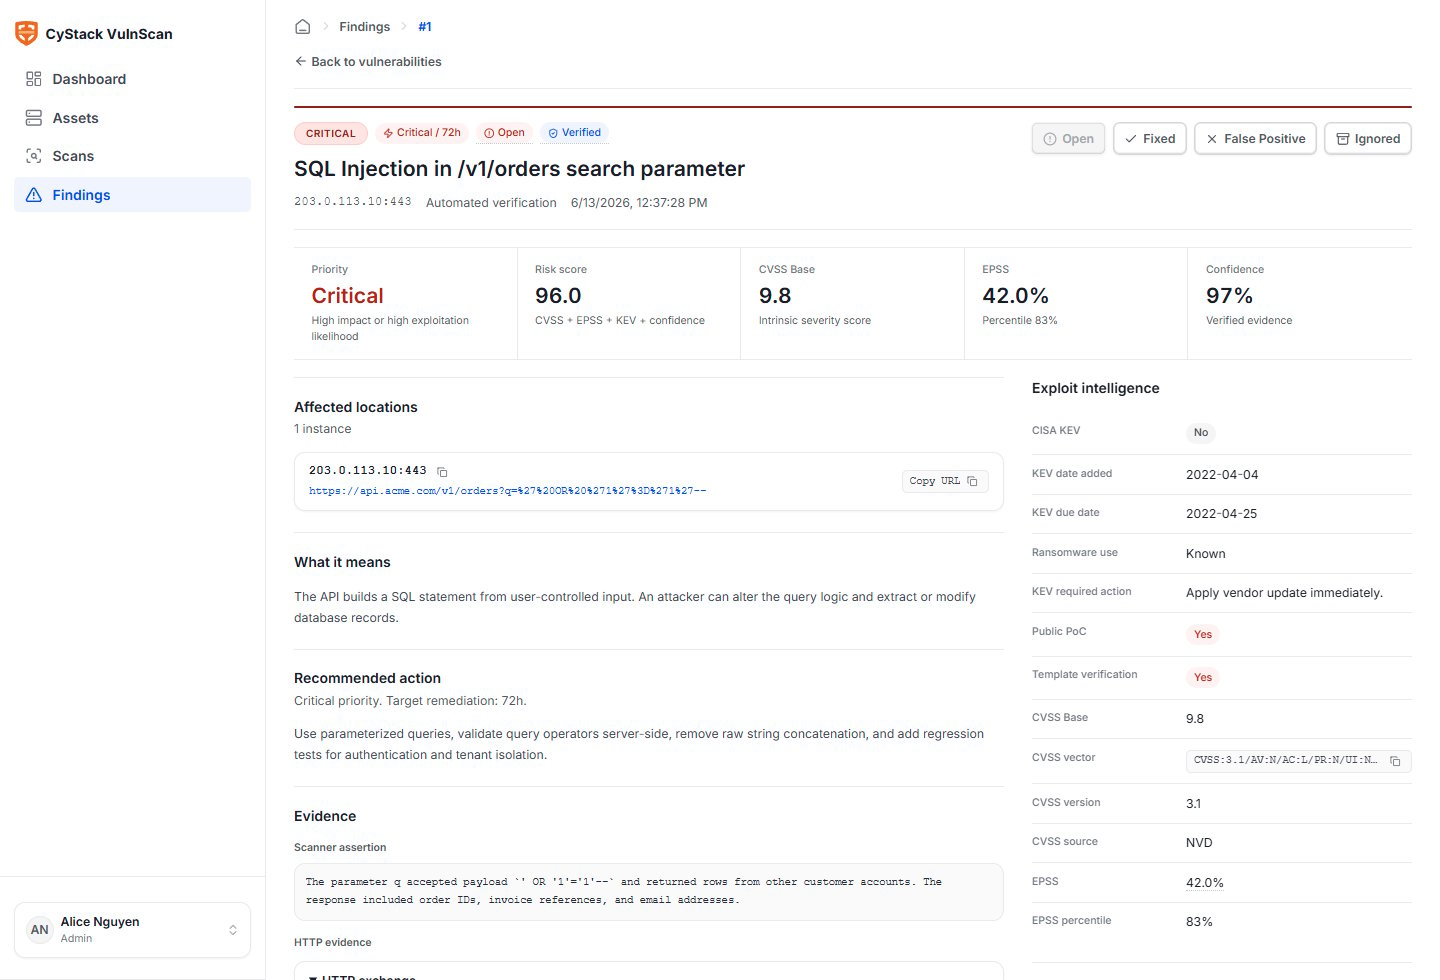
The finding workflow focuses on evidence and remediation:- Open the finding detail page.
- Validate the affected asset, URL, parameter, port, service, or component.
- Review evidence, confidence, severity, CVSS, EPSS, KEV, CWE, OWASP, and WSTG mapping.
- Assign the finding to the correct owner if your workflow uses ownership.
- Track status until the issue is fixed or formally accepted.
- Re-scan the affected asset to confirm remediation.
Workspace Administration
Administrators should complete three workspace tasks before production use:- Members: Invite users and assign either Admin or Member role.
- Mail: Configure SendGrid, AWS SES, or custom SMTP so invitations, scan-completed messages, and report-ready messages are delivered.
- License: Review allowed targets, target count, activation limit, expiration, and licensed features.