> ## Documentation Index
> Fetch the complete documentation index at: https://docs.cystack.net/llms.txt
> Use this file to discover all available pages before exploring further.
# Web UI
> Navigate the VulnScan Web UI and use the main analyst workflows
The Web UI is the primary workspace for CyStack VulnScan. It is designed for security teams that need shared visibility across assets, scans, findings, reports, members, mail settings, and license status.
 ## Main Areas
| Area | Purpose |
| ------------------ | ---------------------------------------------------------------------------------------------------------------------------------- |
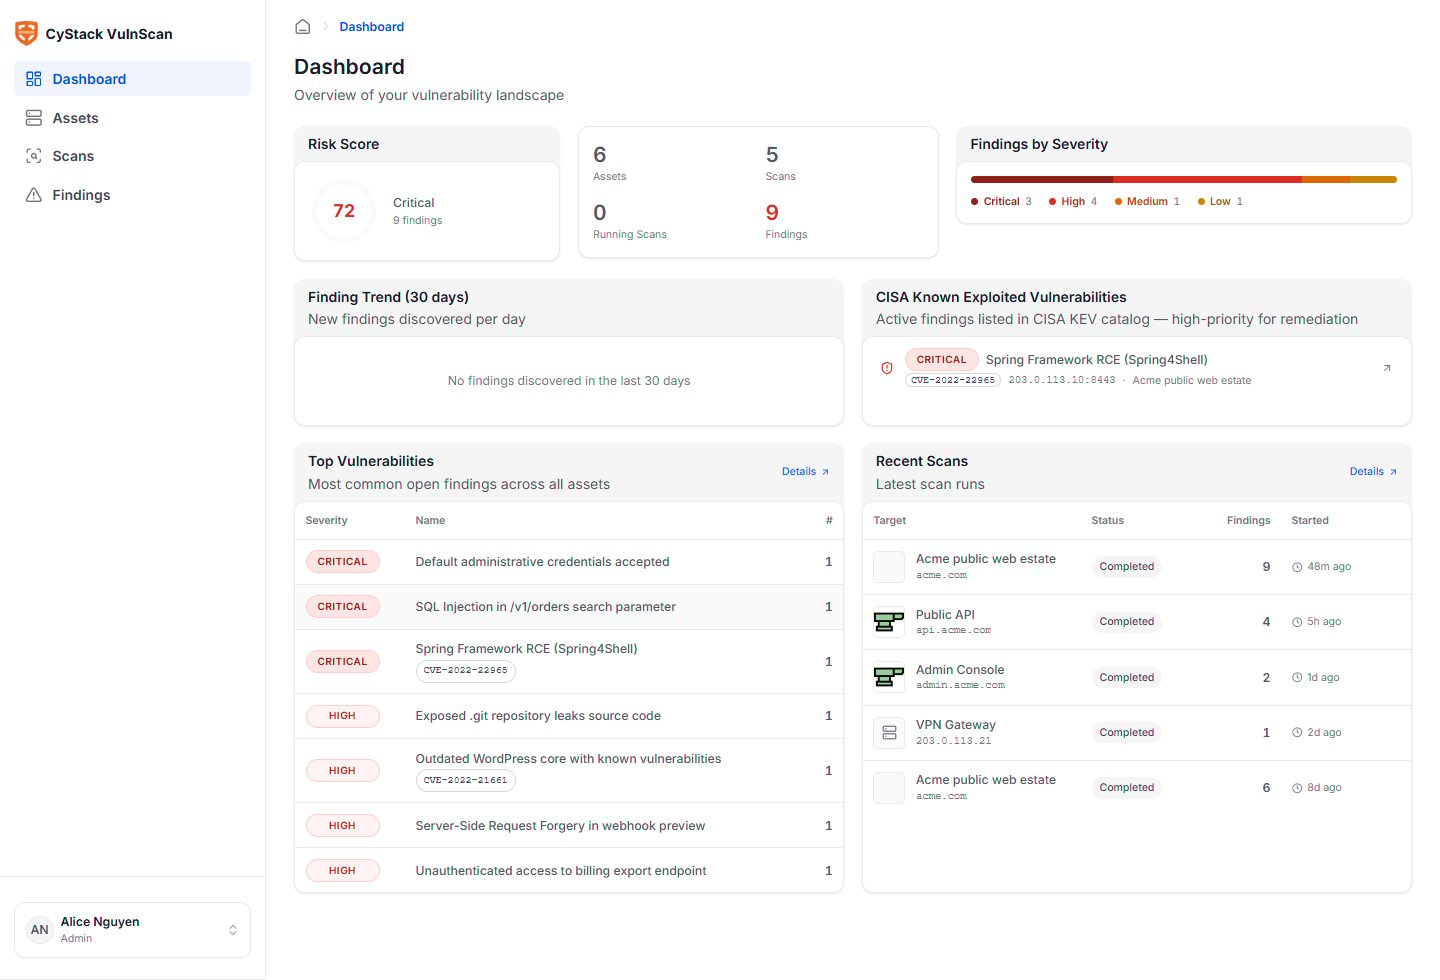
| Dashboard | Executive and operational overview of assets, scans, severities, high-risk findings, and recent activity. |
| Assets | Root domains, URLs, IP addresses, CIDR ranges, discovered subdomains, exposed services, TLS, WAF/CDN, and technology fingerprints. |
| Scans | Scan queue, scan history, source tracking, progress, discovered services, and result summary. |
| Findings | Vulnerability triage, evidence review, risk score, status workflow, ownership, and remediation guidance. |
| Reports | CSV, JSON, and PDF exports for remediation, integration, audit, and management sharing. |
| Workspace settings | Members, mail provider, license detail, workspace-level configuration, and operational settings. |
| User menu | Personal profile, display name, language, password, and logout. |
## Dashboard
Use the dashboard to understand current exposure before drilling into technical detail:
* Total assets under management.
* Number of scans and scan health.
* Critical, High, Medium, Low, and Informational findings.
* Recently completed scans.
* High-priority issues requiring remediation.
* Trend and distribution indicators where enough scan history exists.
The dashboard should be the first page reviewed by an administrator after recurring scans, because it shows whether the external exposure changed and whether newly discovered findings require action.
## User Menu
The user menu is intentionally separated from workspace administration. It contains settings that affect only the signed-in user:
* Personal details and display name.
* Password change.
* Interface language.
* Logout.
Workspace-level settings are available only to administrators in **Workspace settings**.
## Asset Workflow
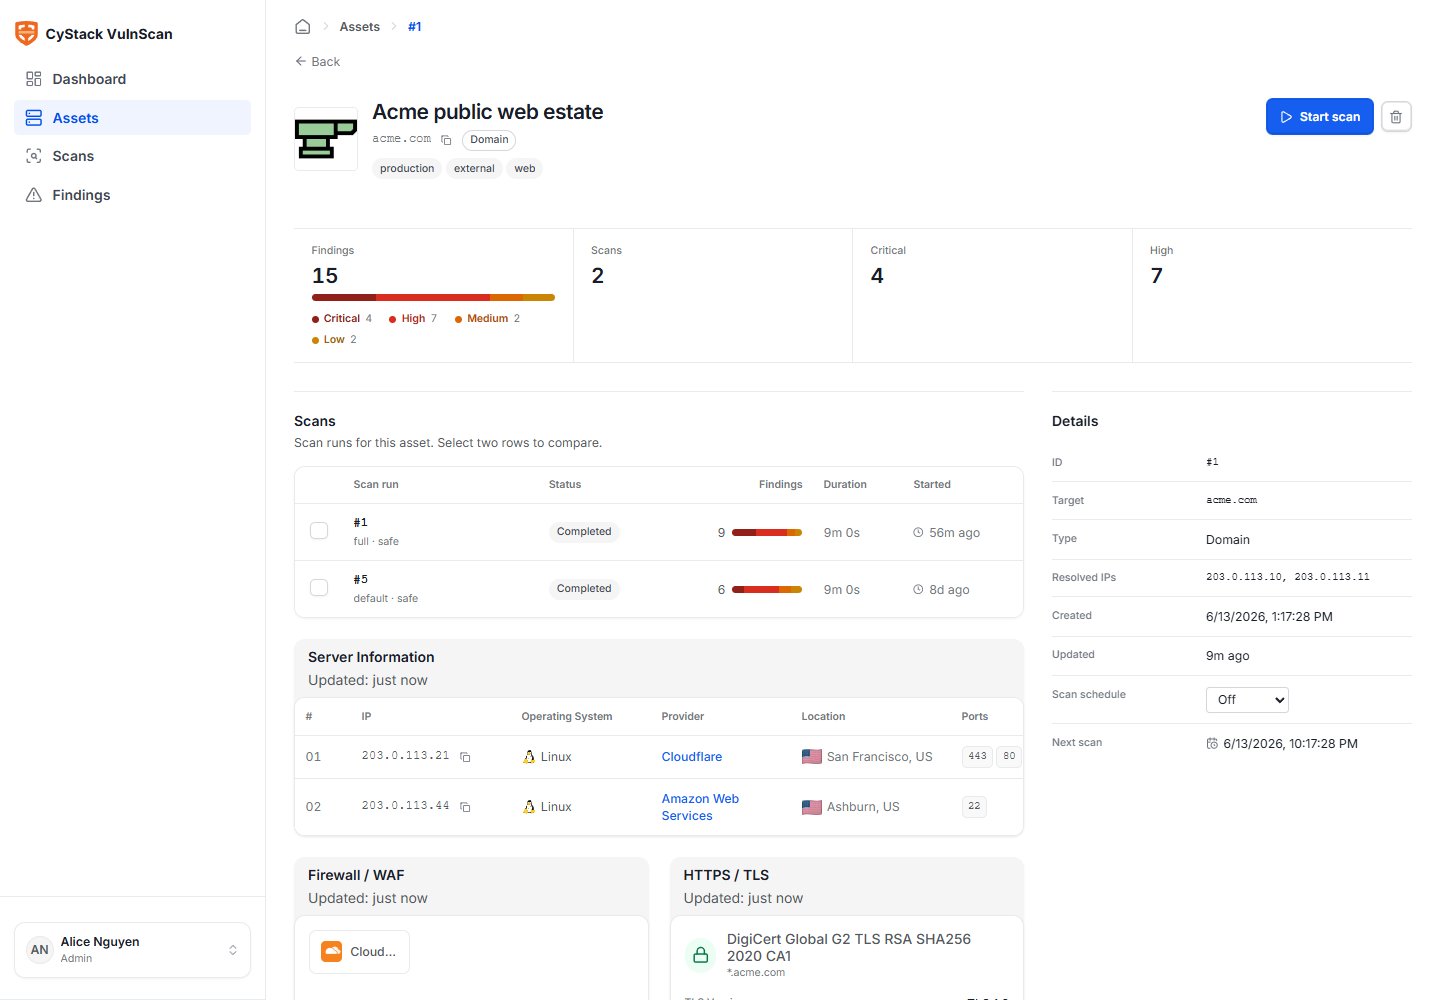
The asset workflow starts with a licensed target and ends with normalized scan scope.
1. Open **Assets**.
2. Add a root domain, URL, IP, or CIDR range.
3. Review discovery signals on the asset detail page.
4. Confirm subdomains, services, TLS, WAF/CDN, and technology fingerprints.
5. Start a scan only after the asset context looks correct.
## Main Areas
| Area | Purpose |
| ------------------ | ---------------------------------------------------------------------------------------------------------------------------------- |
| Dashboard | Executive and operational overview of assets, scans, severities, high-risk findings, and recent activity. |
| Assets | Root domains, URLs, IP addresses, CIDR ranges, discovered subdomains, exposed services, TLS, WAF/CDN, and technology fingerprints. |
| Scans | Scan queue, scan history, source tracking, progress, discovered services, and result summary. |
| Findings | Vulnerability triage, evidence review, risk score, status workflow, ownership, and remediation guidance. |
| Reports | CSV, JSON, and PDF exports for remediation, integration, audit, and management sharing. |
| Workspace settings | Members, mail provider, license detail, workspace-level configuration, and operational settings. |
| User menu | Personal profile, display name, language, password, and logout. |
## Dashboard
Use the dashboard to understand current exposure before drilling into technical detail:
* Total assets under management.
* Number of scans and scan health.
* Critical, High, Medium, Low, and Informational findings.
* Recently completed scans.
* High-priority issues requiring remediation.
* Trend and distribution indicators where enough scan history exists.
The dashboard should be the first page reviewed by an administrator after recurring scans, because it shows whether the external exposure changed and whether newly discovered findings require action.
## User Menu
The user menu is intentionally separated from workspace administration. It contains settings that affect only the signed-in user:
* Personal details and display name.
* Password change.
* Interface language.
* Logout.
Workspace-level settings are available only to administrators in **Workspace settings**.
## Asset Workflow
The asset workflow starts with a licensed target and ends with normalized scan scope.
1. Open **Assets**.
2. Add a root domain, URL, IP, or CIDR range.
3. Review discovery signals on the asset detail page.
4. Confirm subdomains, services, TLS, WAF/CDN, and technology fingerprints.
5. Start a scan only after the asset context looks correct.
 ## Scan Workflow
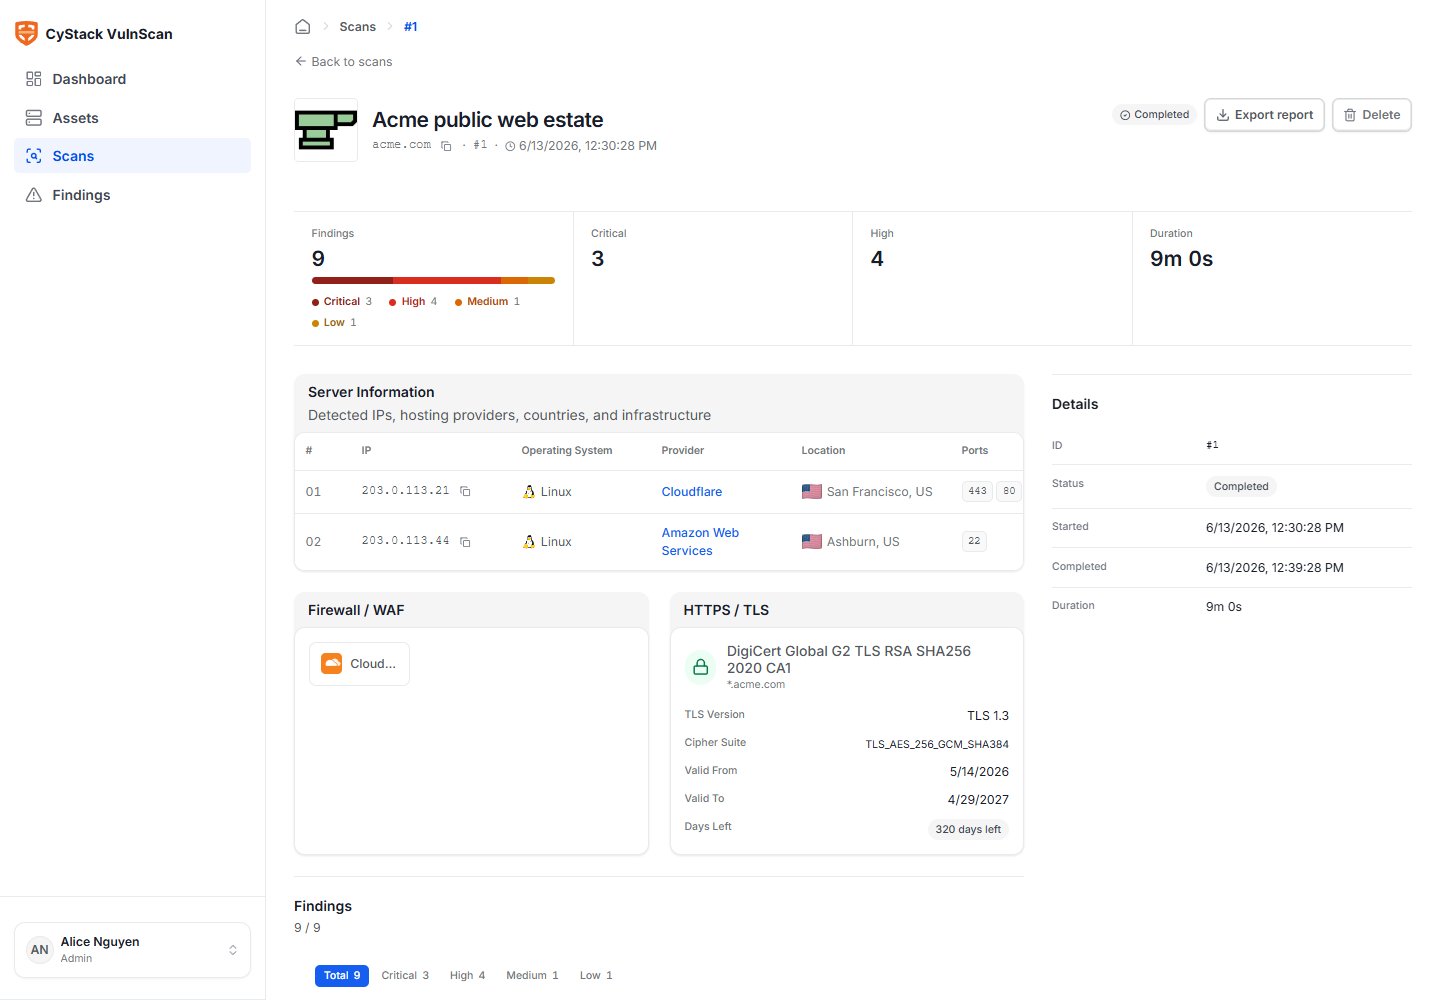
The scan workflow is designed to make scope and source visible:
1. Start a scan from the asset detail page or scan list.
2. Add authentication context if the application requires it.
3. Monitor status in the scan detail page.
4. Review discovered services and vulnerability counts.
5. Triage findings from Critical to Low.
6. Export CSV/JSON for technical workflows or PDF for management distribution.
## Scan Workflow
The scan workflow is designed to make scope and source visible:
1. Start a scan from the asset detail page or scan list.
2. Add authentication context if the application requires it.
3. Monitor status in the scan detail page.
4. Review discovered services and vulnerability counts.
5. Triage findings from Critical to Low.
6. Export CSV/JSON for technical workflows or PDF for management distribution.
 ## Finding Workflow
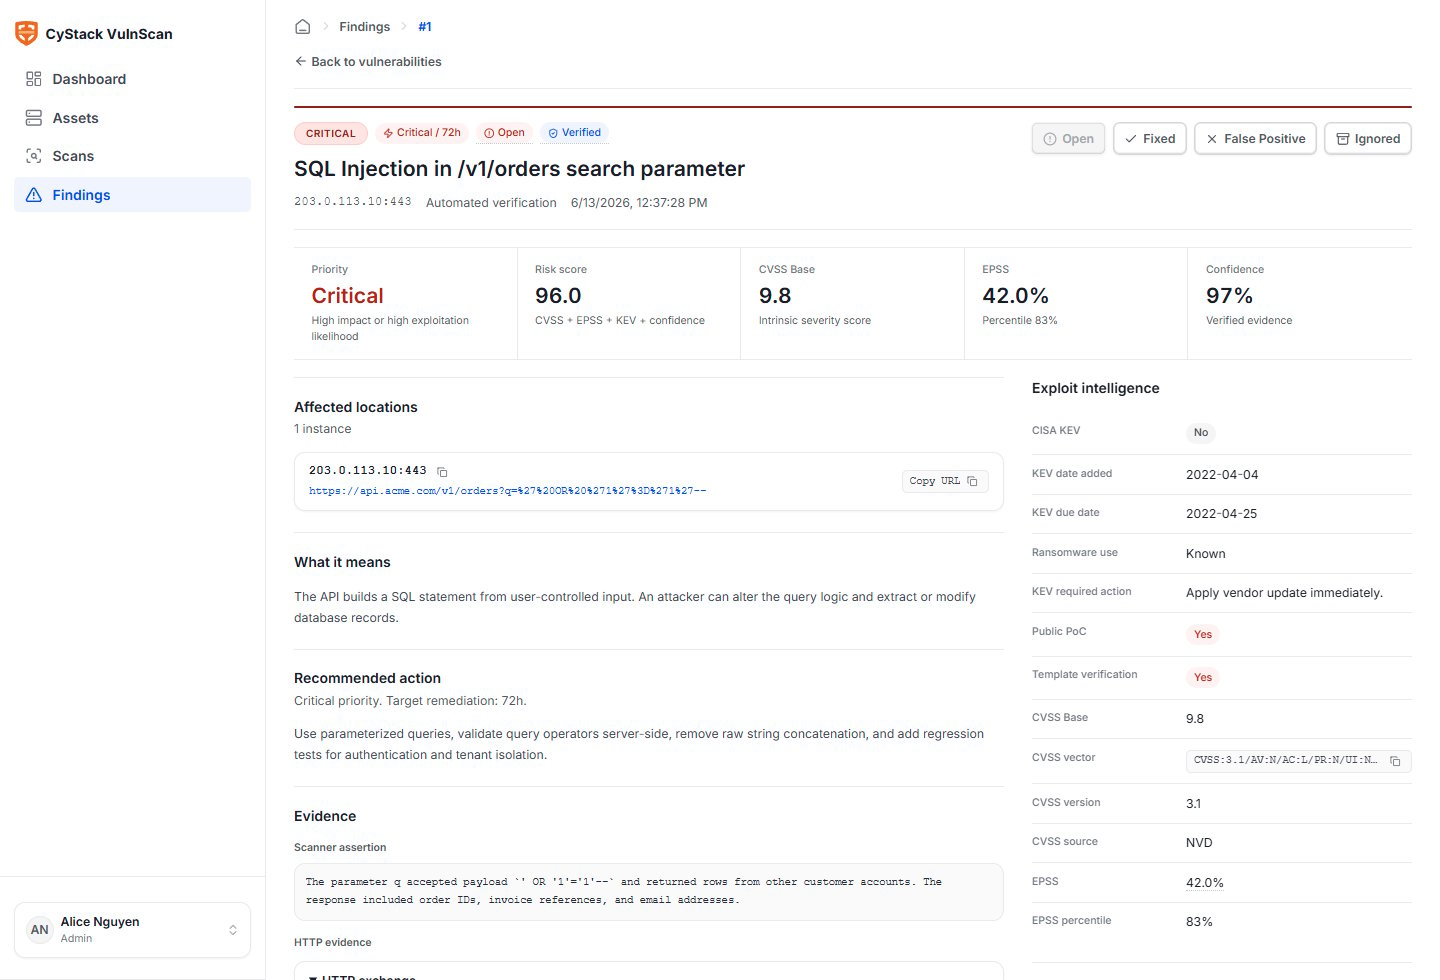
The finding workflow focuses on evidence and remediation:
1. Open the finding detail page.
2. Validate the affected asset, URL, parameter, port, service, or component.
3. Review evidence, confidence, severity, CVSS, EPSS, KEV, CWE, OWASP, and WSTG mapping.
4. Assign the finding to the correct owner if your workflow uses ownership.
5. Track status until the issue is fixed or formally accepted.
6. Re-scan the affected asset to confirm remediation.
## Finding Workflow
The finding workflow focuses on evidence and remediation:
1. Open the finding detail page.
2. Validate the affected asset, URL, parameter, port, service, or component.
3. Review evidence, confidence, severity, CVSS, EPSS, KEV, CWE, OWASP, and WSTG mapping.
4. Assign the finding to the correct owner if your workflow uses ownership.
5. Track status until the issue is fixed or formally accepted.
6. Re-scan the affected asset to confirm remediation.
 ## Workspace Administration
Administrators should complete three workspace tasks before production use:
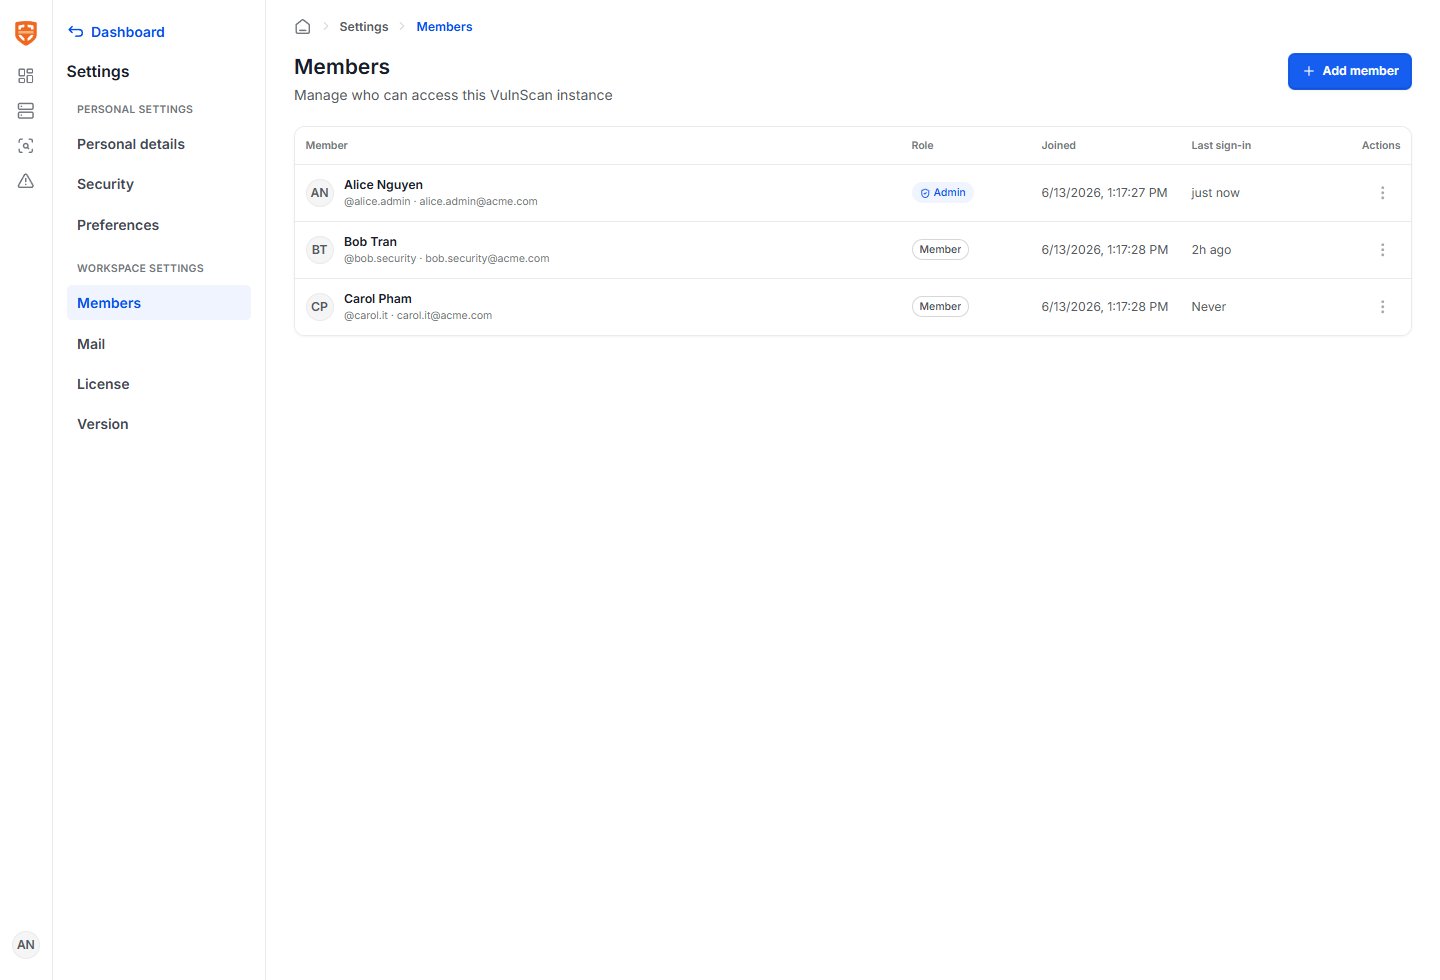
* **Members**: Invite users and assign either Admin or Member role.
* **Mail**: Configure SendGrid, AWS SES, or custom SMTP so invitations, scan-completed messages, and report-ready messages are delivered.
* **License**: Review allowed targets, target count, activation limit, expiration, and licensed features.
## Workspace Administration
Administrators should complete three workspace tasks before production use:
* **Members**: Invite users and assign either Admin or Member role.
* **Mail**: Configure SendGrid, AWS SES, or custom SMTP so invitations, scan-completed messages, and report-ready messages are delivered.
* **License**: Review allowed targets, target count, activation limit, expiration, and licensed features.
 ## Web UI and CLI Consistency
The Web UI and CLI use the same scanning core and the same persisted workspace data for standard scans. Results created through the CLI are visible in the Web UI when they use the same workspace configuration, and the scan source identifies whether the scan came from Web UI, CLI, or schedule.
## Web UI and CLI Consistency
The Web UI and CLI use the same scanning core and the same persisted workspace data for standard scans. Results created through the CLI are visible in the Web UI when they use the same workspace configuration, and the scan source identifies whether the scan came from Web UI, CLI, or schedule.