> ## Documentation Index
> Fetch the complete documentation index at: https://docs.cystack.net/llms.txt
> Use this file to discover all available pages before exploring further.
# Monitoring & analytics
> Track site health, security events, suspicious sources, and WAF traffic analytics
CyStack WAF provides real-time traffic visibility so your security team knows what the WAF is blocking, who is attacking, and whether sites are healthy. This section covers four views: **health overview**, **security events**, **suspicious activity**, and **analytics**.
## Site overview
The **Overview** page for each site summarizes its protection status and recent traffic.
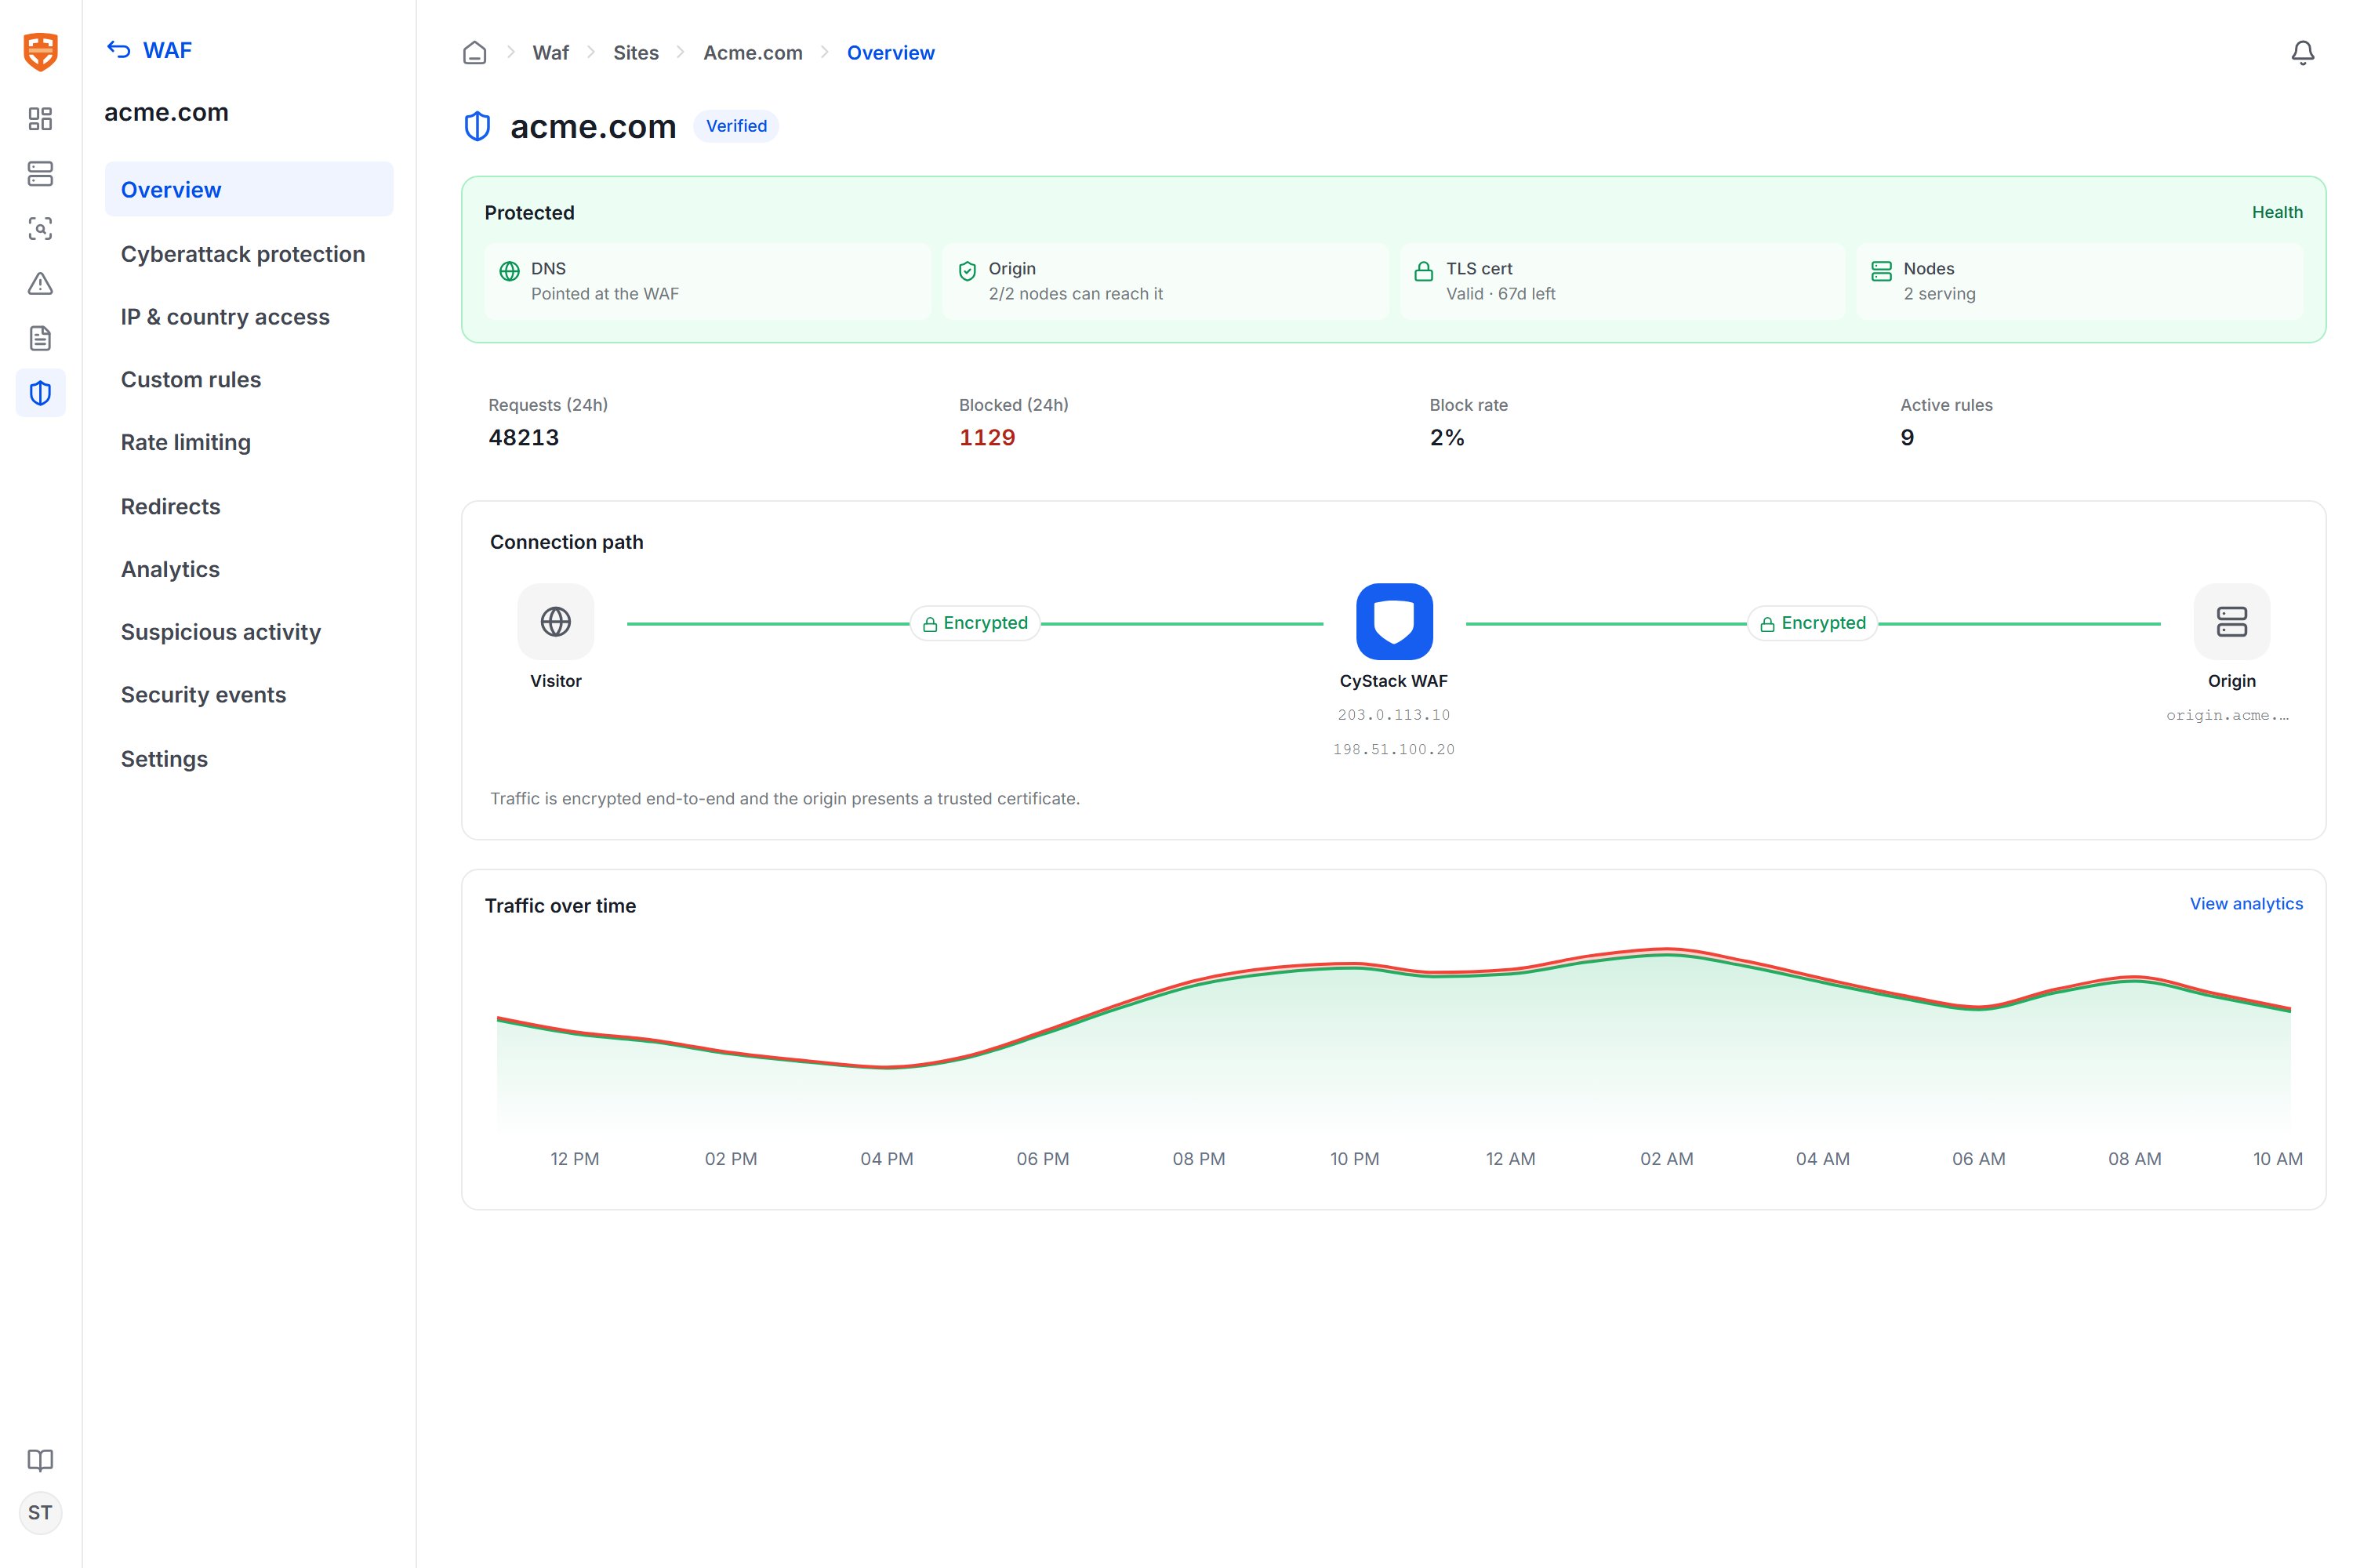 * **Health cards** check layer by layer: DNS is pointed to the WAF, the origin is reachable, the TLS certificate is valid (with days remaining), and a node is serving.
* **24-hour metrics**: total requests, blocked requests, block rate, and number of active rules.
* **Connection diagram**: illustrates the Client → CyStack WAF → Origin path along with encryption status.
* **Traffic chart**: allowed and blocked traffic over time.
## Security events
The **Security events** page lists requests blocked or logged by the WAF, newest at the top.
* **Health cards** check layer by layer: DNS is pointed to the WAF, the origin is reachable, the TLS certificate is valid (with days remaining), and a node is serving.
* **24-hour metrics**: total requests, blocked requests, block rate, and number of active rules.
* **Connection diagram**: illustrates the Client → CyStack WAF → Origin path along with encryption status.
* **Traffic chart**: allowed and blocked traffic over time.
## Security events
The **Security events** page lists requests blocked or logged by the WAF, newest at the top.
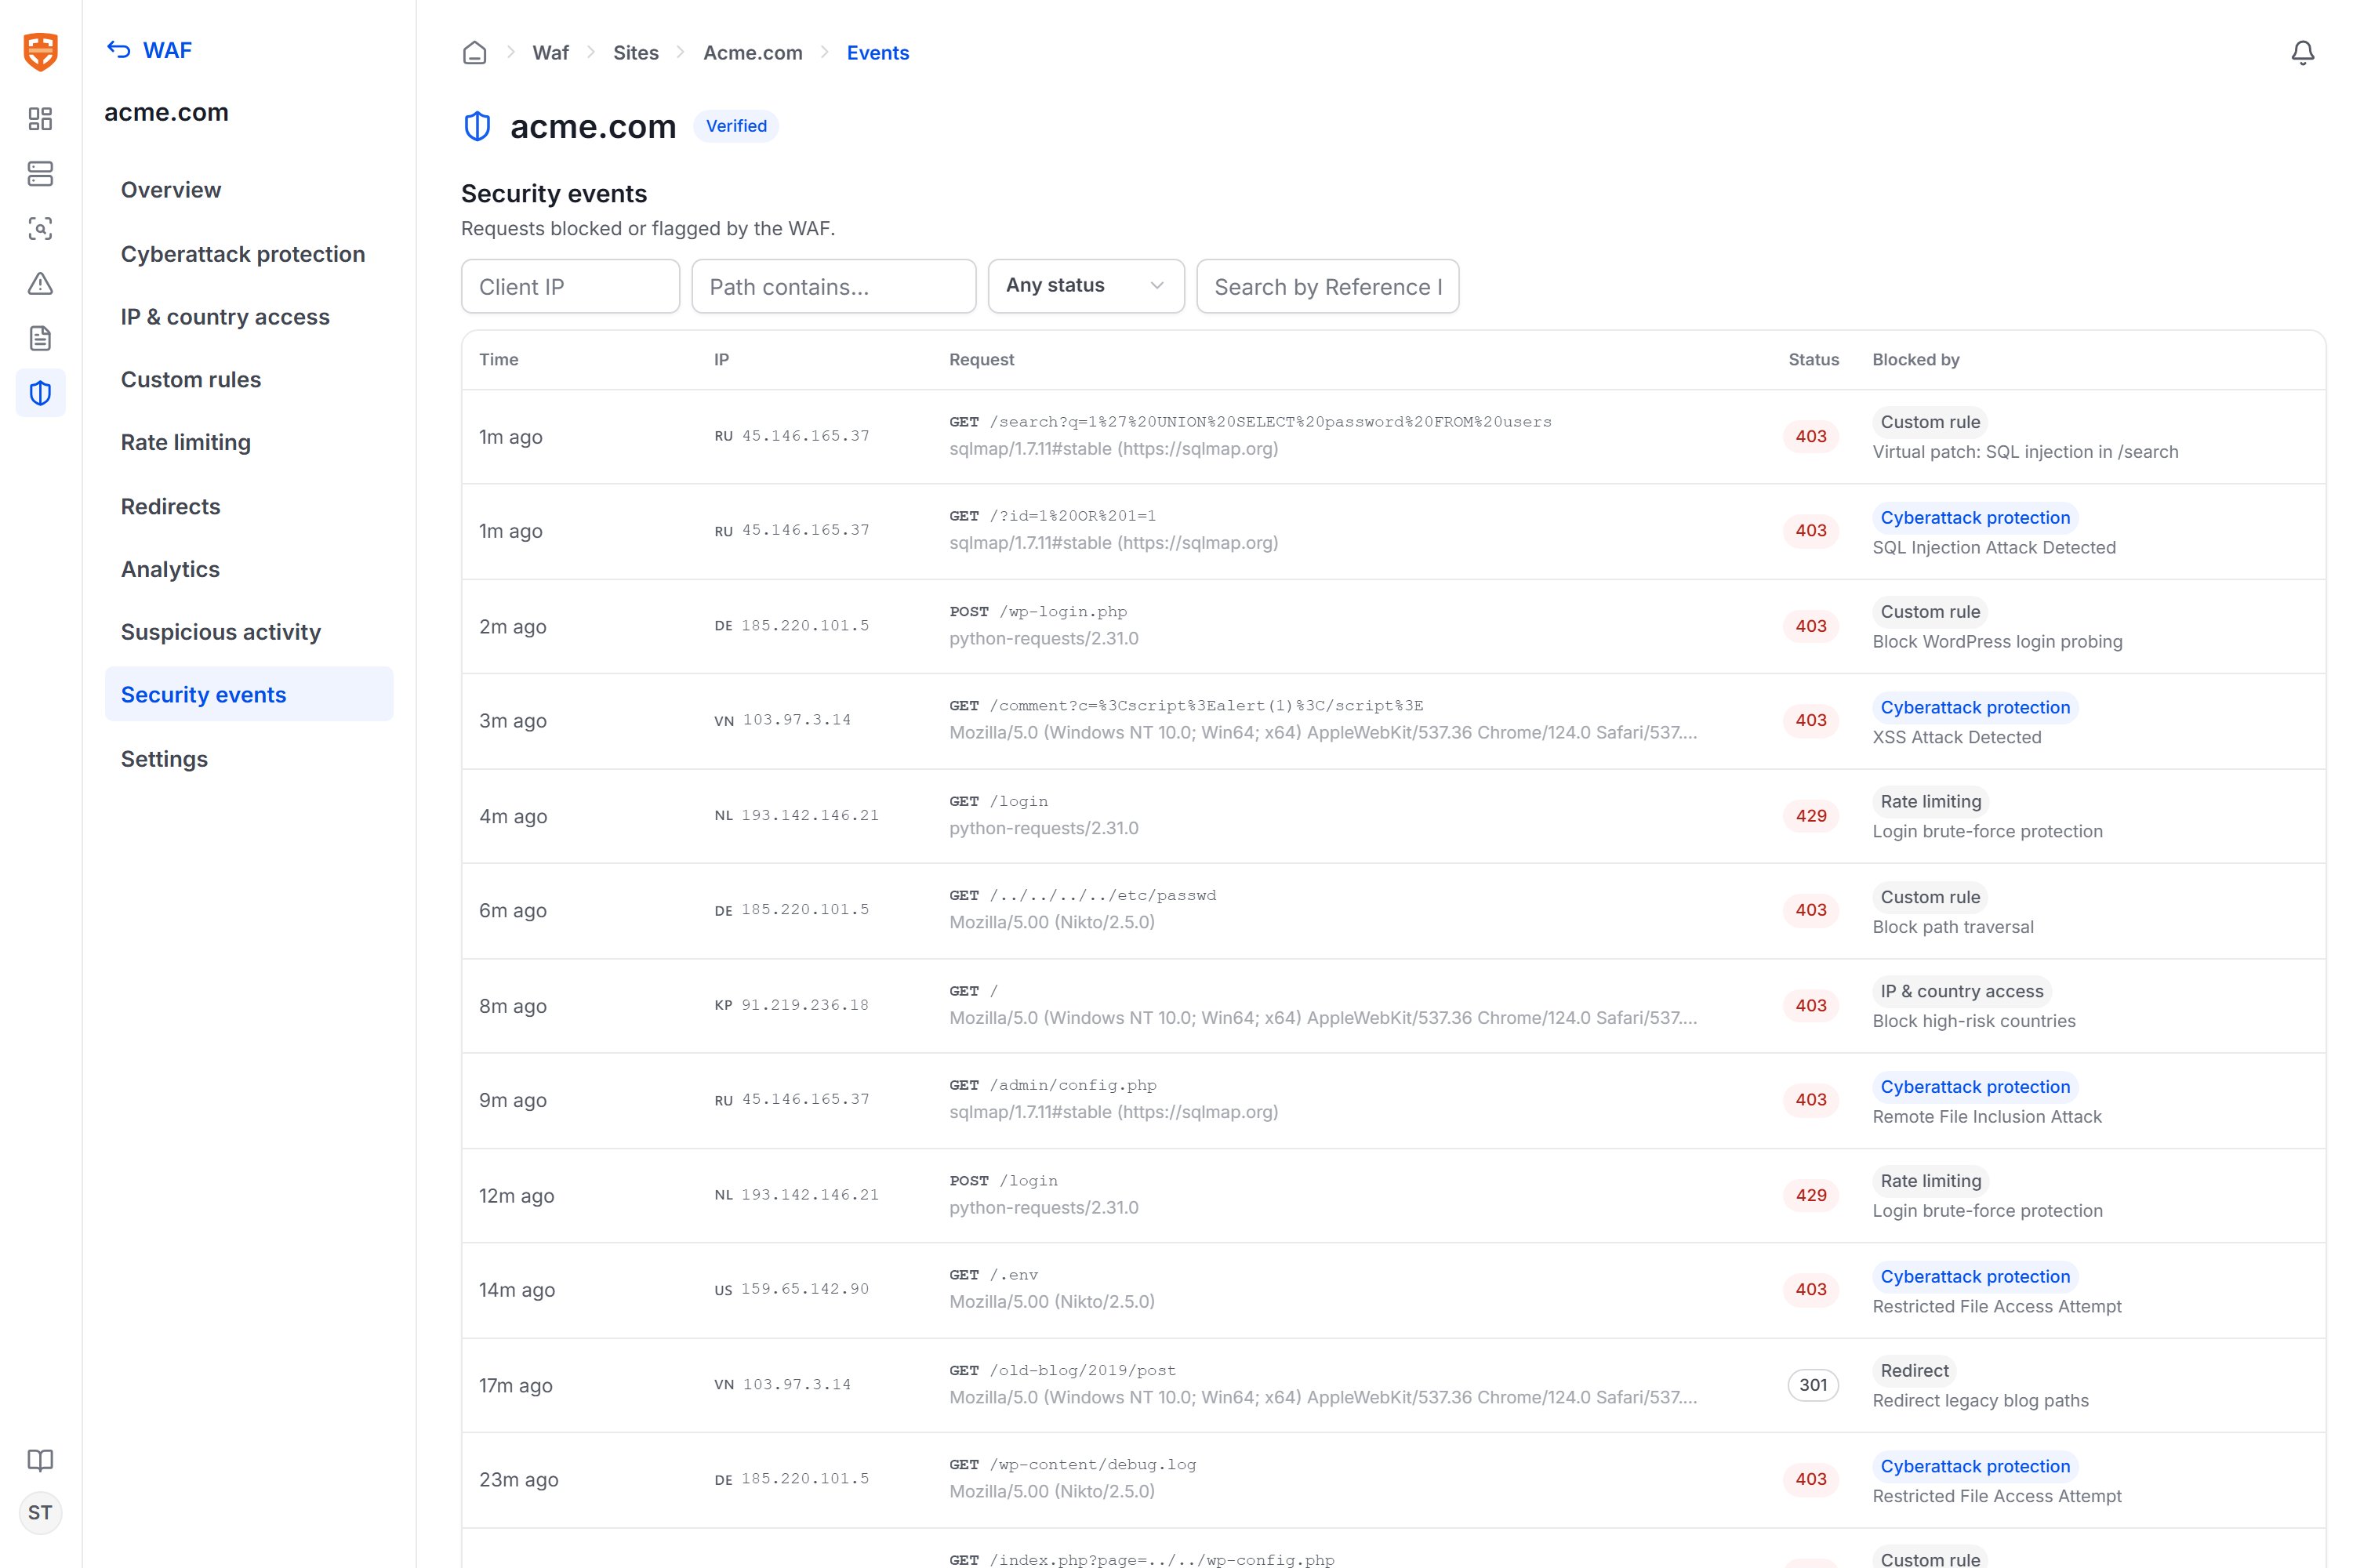 | Column | Content |
| -------------- | ---------------------------------------------------------------------------------------------------------------------------------- |
| **Time** | When it occurred (relative, with the full timestamp available). |
| **IP** | Source address with a country flag. |
| **Request** | Method and path, along with the User-Agent. |
| **Status** | The HTTP status code returned (403, 429, 301, etc.) or a log label. |
| **Blocked by** | The matched rule group (managed ruleset, custom rule, rate limiting, access control, etc.) along with a description and rule code. |
Filters let you narrow by **IP**, **path**, **status code**, and **Reference ID** (the reference code shown to end users when they are blocked). Open an event's details to see the full host, country, action, matched rule code, message, and User-Agent, along with a link to the corresponding rule configuration page.
When a legitimate user reports being blocked by mistake, ask them for the **Reference ID** shown on the error page, then search by that code to pinpoint exactly which rule blocked them and adjust it.
## Suspicious activity
The **Suspicious activity** page analyzes recent traffic and automatically flags IPs that show signs of attack but may not yet have been blocked — for example, scanning below the block threshold.
| Column | Content |
| -------------- | ---------------------------------------------------------------------------------------------------------------------------------- |
| **Time** | When it occurred (relative, with the full timestamp available). |
| **IP** | Source address with a country flag. |
| **Request** | Method and path, along with the User-Agent. |
| **Status** | The HTTP status code returned (403, 429, 301, etc.) or a log label. |
| **Blocked by** | The matched rule group (managed ruleset, custom rule, rate limiting, access control, etc.) along with a description and rule code. |
Filters let you narrow by **IP**, **path**, **status code**, and **Reference ID** (the reference code shown to end users when they are blocked). Open an event's details to see the full host, country, action, matched rule code, message, and User-Agent, along with a link to the corresponding rule configuration page.
When a legitimate user reports being blocked by mistake, ask them for the **Reference ID** shown on the error page, then search by that code to pinpoint exactly which rule blocked them and adjust it.
## Suspicious activity
The **Suspicious activity** page analyzes recent traffic and automatically flags IPs that show signs of attack but may not yet have been blocked — for example, scanning below the block threshold.
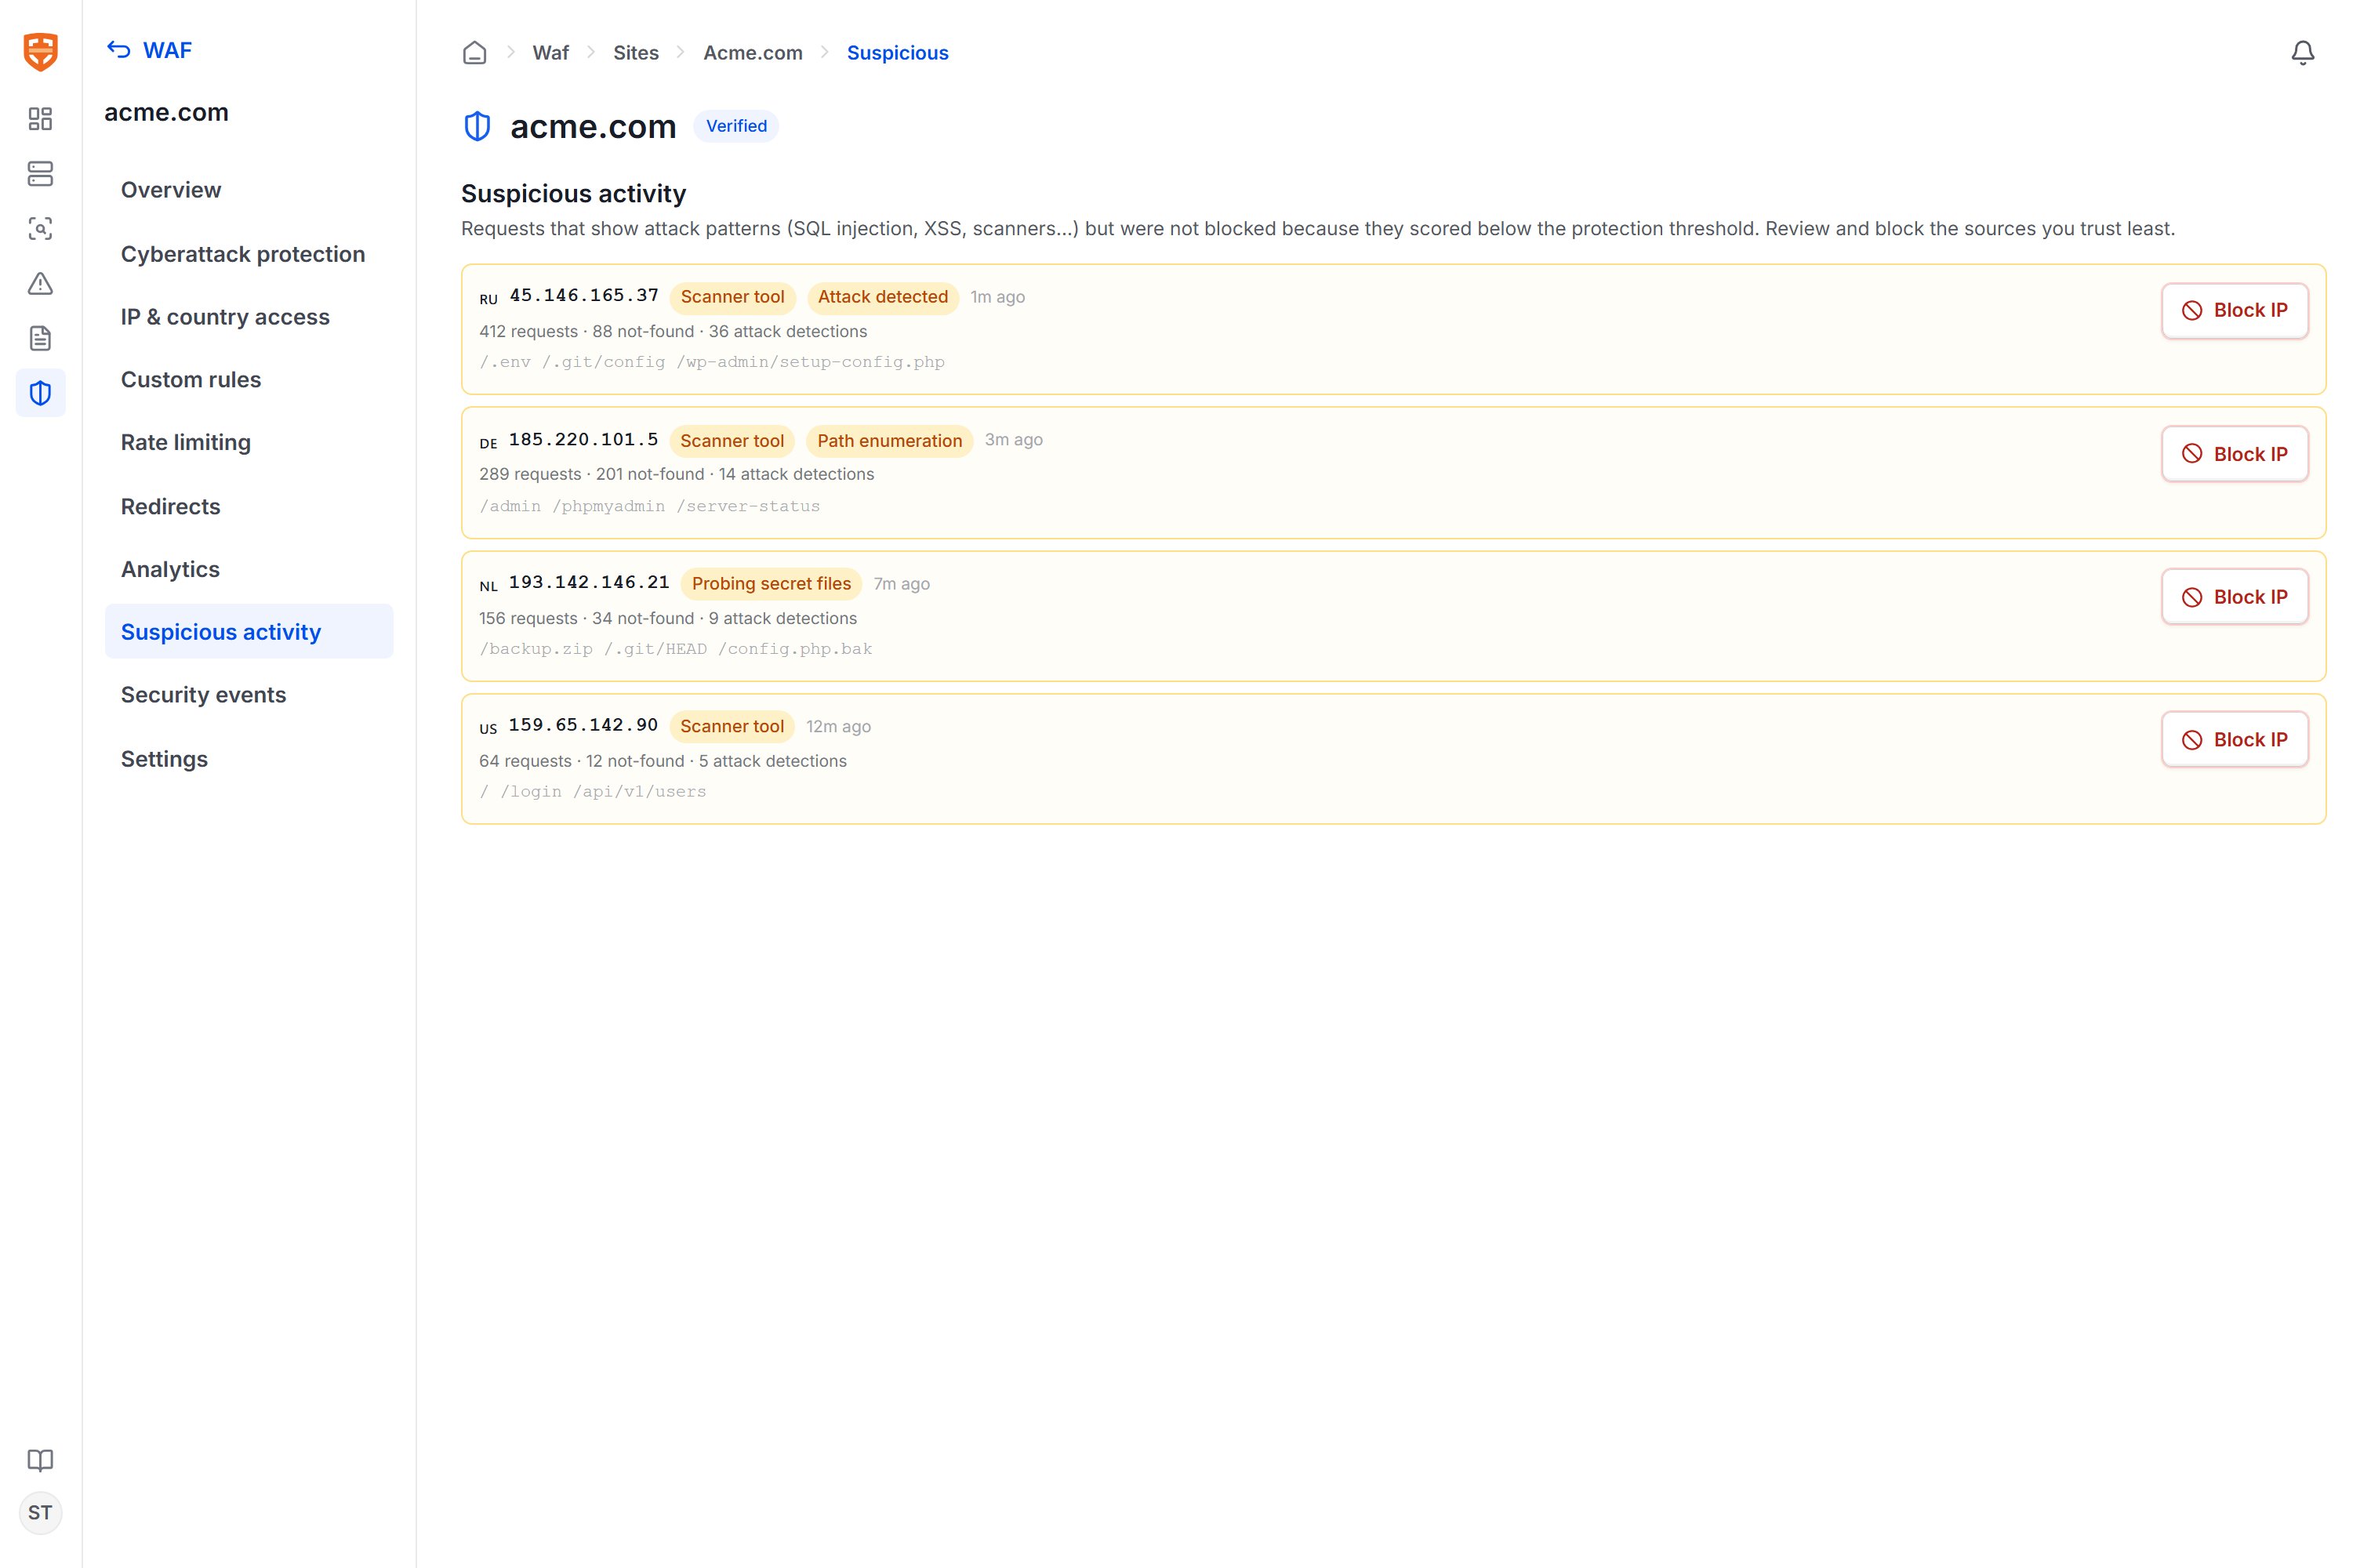 Each source shows:
* **IP and country** along with reason labels: scanning tool, attack detected, sensitive path scanning, enumeration.
* **Statistics**: total requests, number of 404 responses, and number of detected attacks.
* **Sample paths** the source has tried (for example `/.env`, `/.git/config`, `/phpmyadmin`).
* A **Block IP** button to immediately create a rule blocking that IP.
This is an early-detection tool: attackers usually scan before launching a real attack, so blocking suspicious sources early helps stop them before they find a weak point.
## Analytics
The **Analytics** page aggregates all traffic passing through the WAF over a **24-hour**, **7-day**, or **30-day** window.
Each source shows:
* **IP and country** along with reason labels: scanning tool, attack detected, sensitive path scanning, enumeration.
* **Statistics**: total requests, number of 404 responses, and number of detected attacks.
* **Sample paths** the source has tried (for example `/.env`, `/.git/config`, `/phpmyadmin`).
* A **Block IP** button to immediately create a rule blocking that IP.
This is an early-detection tool: attackers usually scan before launching a real attack, so blocking suspicious sources early helps stop them before they find a weak point.
## Analytics
The **Analytics** page aggregates all traffic passing through the WAF over a **24-hour**, **7-day**, or **30-day** window.
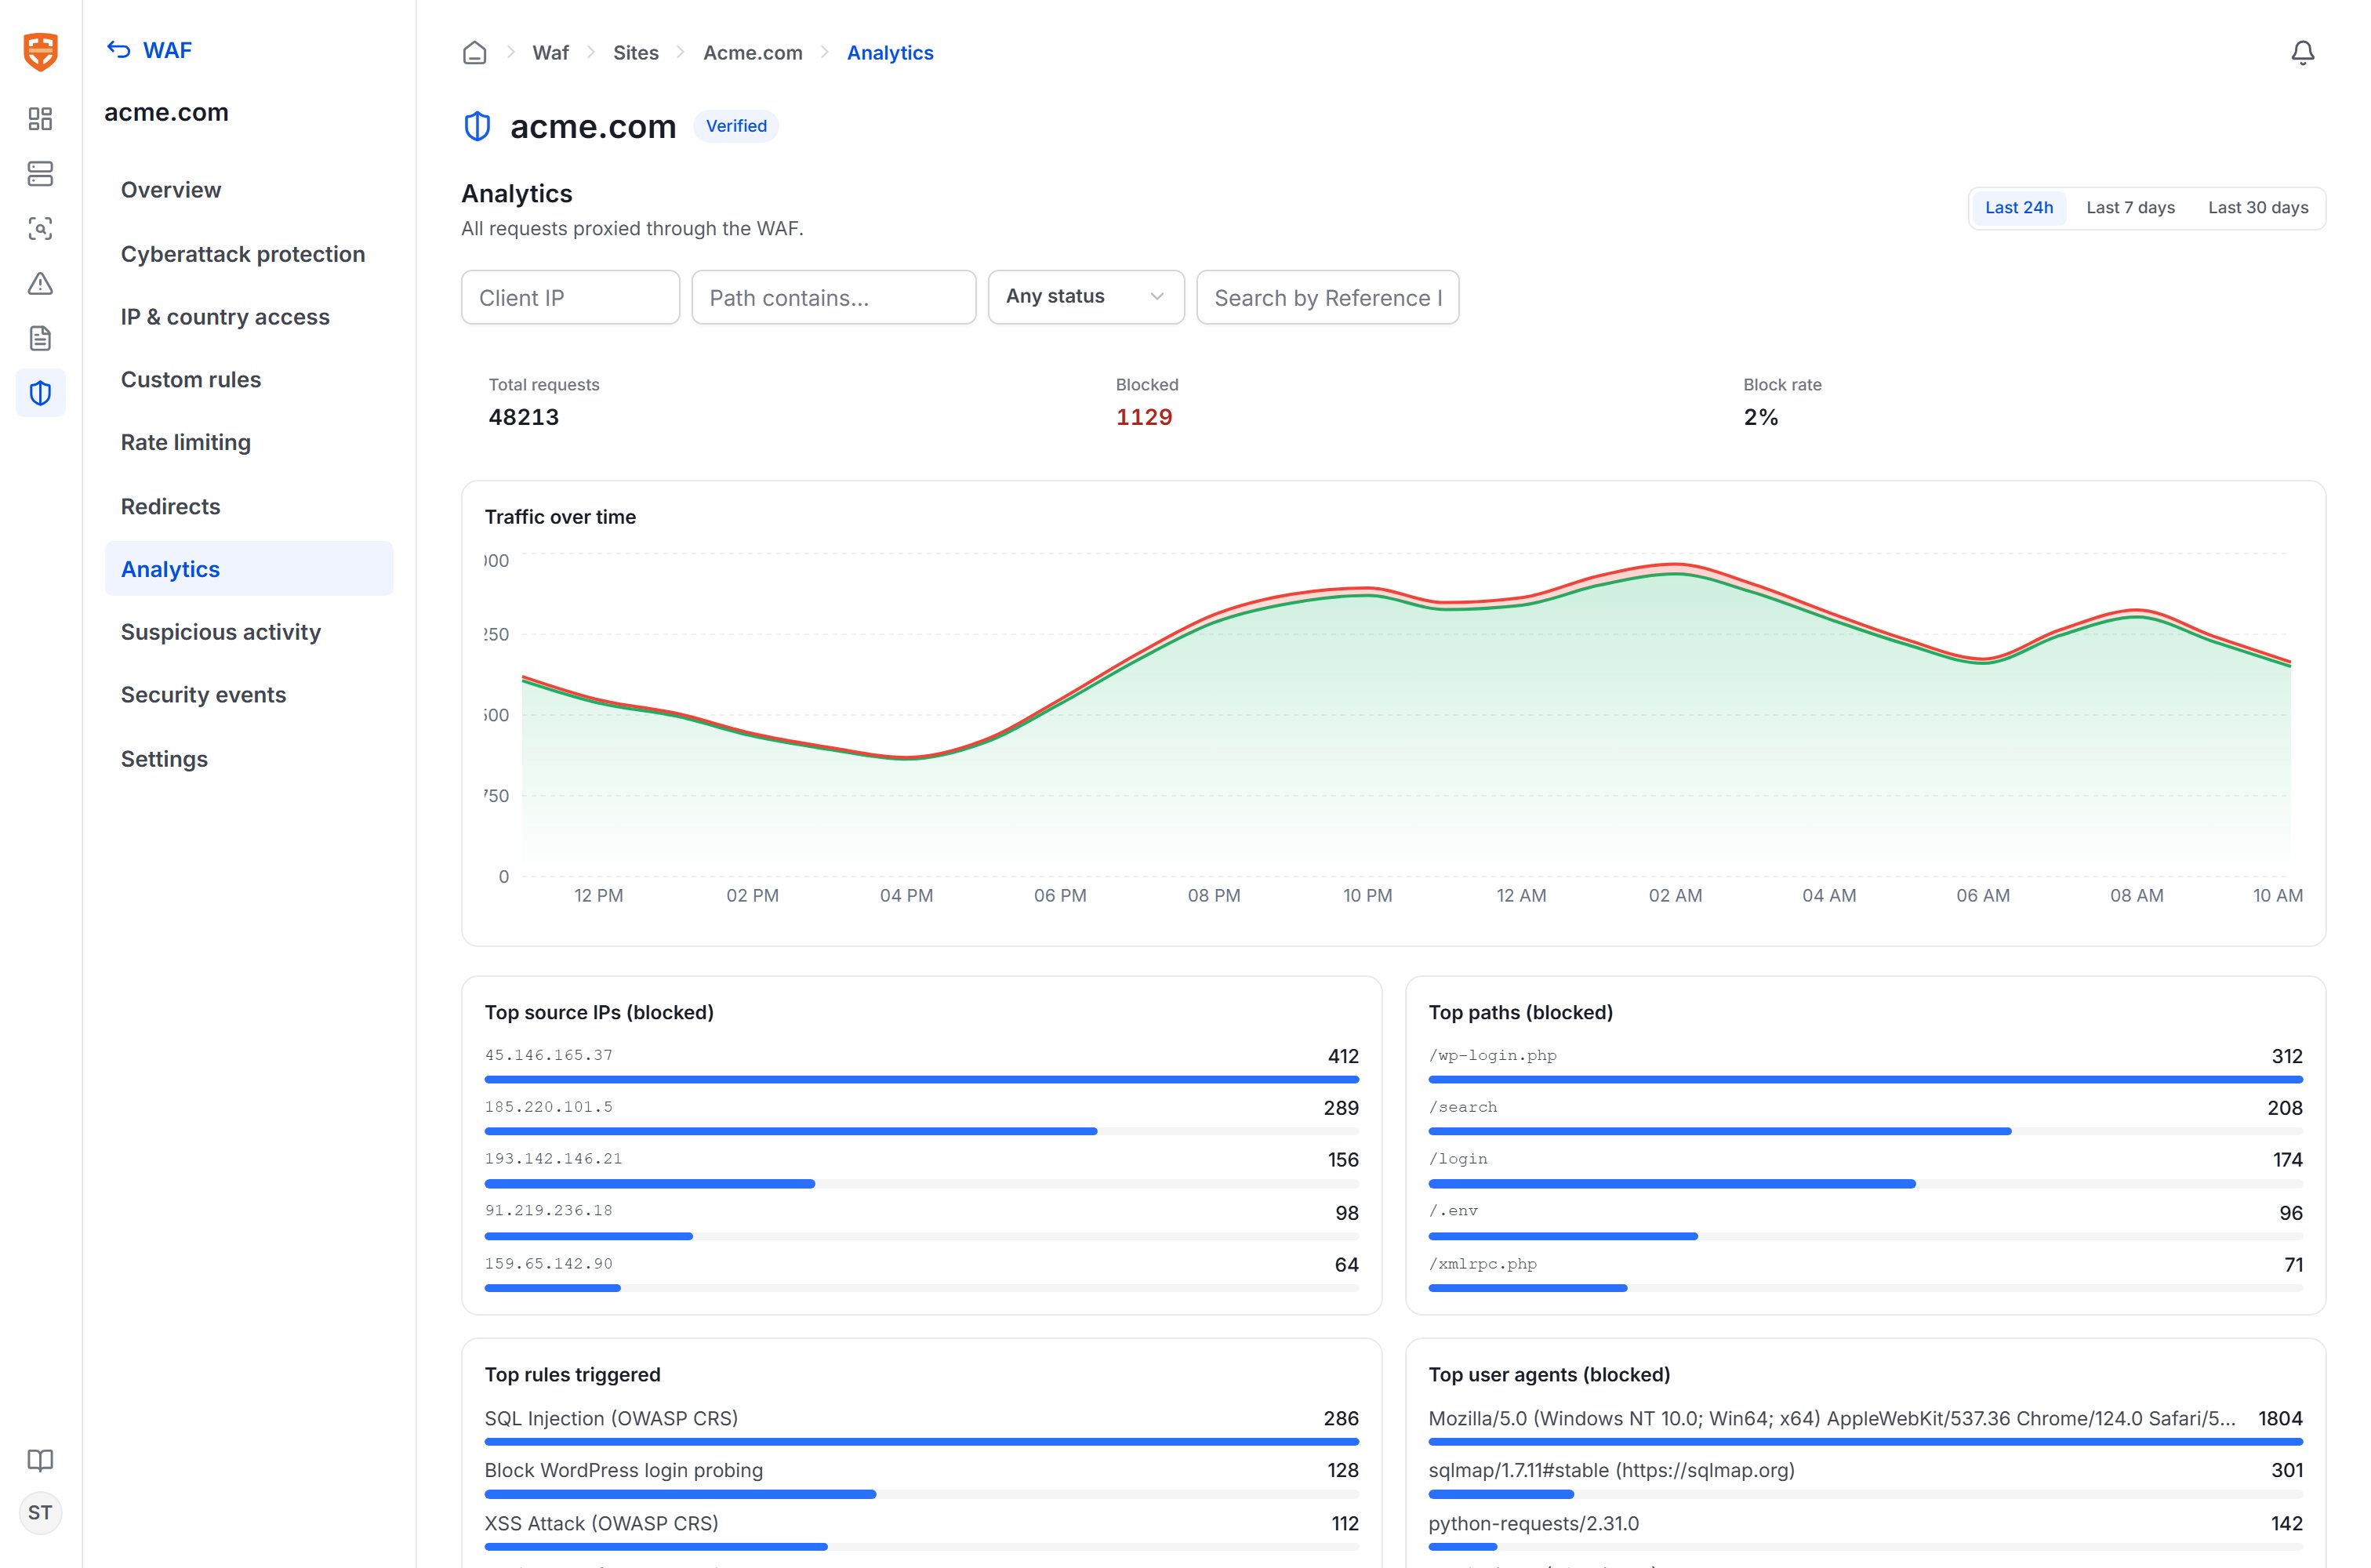 * **Aggregate metrics**: total requests, total blocked, and block rate.
* **Traffic chart**: allowed and blocked traffic over time.
* **Top lists**: top source IPs, most-blocked paths, most-triggered rules, and top User-Agents.
The top lists are clickable to quickly filter to the corresponding events, helping you trace from aggregate figures down to individual requests. They use the same filters by IP/path/status/Reference ID as the events page.
## Retention and notifications
* **Event retention** can be configured in the WAF settings (for example, 30 days). Events older than the threshold are cleaned up automatically.
* **Email notifications** are sent when a site is verified successfully, when a new rule is created (including AI-generated virtual patches), and when a site loses serviceability (no ready node remains or the origin is down). Configure email in the workspace settings.
## Recommended monitoring workflow
1. Watch the **Overview** to ensure the health cards stay green.
2. Review **Security events** regularly, especially after tightening rules, to catch false blocks.
3. Handle **Suspicious activity**: block clear scanning sources.
4. Use **Analytics** to identify attack trends and adjust [protection rules](/en/vulnscan/waf-rules) accordingly.
* **Aggregate metrics**: total requests, total blocked, and block rate.
* **Traffic chart**: allowed and blocked traffic over time.
* **Top lists**: top source IPs, most-blocked paths, most-triggered rules, and top User-Agents.
The top lists are clickable to quickly filter to the corresponding events, helping you trace from aggregate figures down to individual requests. They use the same filters by IP/path/status/Reference ID as the events page.
## Retention and notifications
* **Event retention** can be configured in the WAF settings (for example, 30 days). Events older than the threshold are cleaned up automatically.
* **Email notifications** are sent when a site is verified successfully, when a new rule is created (including AI-generated virtual patches), and when a site loses serviceability (no ready node remains or the origin is down). Configure email in the workspace settings.
## Recommended monitoring workflow
1. Watch the **Overview** to ensure the health cards stay green.
2. Review **Security events** regularly, especially after tightening rules, to catch false blocks.
3. Handle **Suspicious activity**: block clear scanning sources.
4. Use **Analytics** to identify attack trends and adjust [protection rules](/en/vulnscan/waf-rules) accordingly.